This is the analysis part where we do a small analysis to find
- Which are the most important/popular tweets
- Whether older materials covered important concepts than recent tweets
Load the necessary libs
%load_ext autoreload
%autoreload 2
%matplotlib inline


import pandas as pd
pd.set_option("display.width", 150)
import requests
import re
import matplotlib.pyplot as plt
import matplotlib.image as mpimg
from pathlib import Path
Load csv
df = pd.read_csv("chrisalbon_mlflashcards.csv")
df['text'].fillna('', inplace=True)
df.tail()
 id  likes  replies  retweets            text       timestamp             url         img_url
236  94607825069...     19        1         0     Bayes Error  2017-12-27T...  https://twi...  https://pbs...
237  94575108497...     47        3        13    Occams Razor  2017-12-26T...  https://twi...  https://pbs...
238  94571793723...      8        0         1  K-Fold Cros...  2017-12-26T...  https://twi...  https://pbs...
239  94538342129...     18        1         1         Extrema  2017-12-25T...  https://twi...  https://pbs...
240  94536381783...     34        1         7  Softmax Act...  2017-12-25T...  https://twi...  https://pbs...
Check for missing values
df.count(axis=0)
id           241
likes        241
replies      241
retweets     241
text         241
timestamp    241
url          241
img_url      237
dtype: int64
We see we have few img_urls missing. Let’s check what they are
df[df.img_url.isnull()]
  id  likes  replies  retweets text            timestamp                       url img_url
83   930450506744414208     52        3         0       2017-11-14T15:01:02  https://twitter.com/c...     NaN
193  902952380160892928      1        0         0       2017-08-30T17:53:18  https://twitter.com/c...     NaN
198  901323838675337216      0        1         0       2017-08-26T06:02:03  https://twitter.com/c...     NaN
226  948412638148444160      3        0         0       2018-01-03T04:36:08  https://twitter.com/c...     NaN
These are false poisitives from our search. They contain the search term but doesn’t contain an image and can be neglected
Drop invalid rows
df = df.dropna(subset=['img_url'])
df.count(axis=0)
Check again after droping invalid rows
id           237
likes        237
replies      237
retweets     237
text         237
timestamp    237
url          237
img_url      237
dtype: int64
Check datatypes
Let’s check the datatype to see if they are what we want.
Especially we have to have timestamp as datetime column. Let’s check and convert the datatype if it is not.
Check
df.dtypes
id            int64
likes         int64
replies       int64
retweets      int64
text         object
timestamp    object
url          object
img_url      object
dtype: object
Convert
df.timestamp = pd.to_datetime(df.timestamp, infer_datetime_format=True)
df.dtypes
id                    int64
likes                 int64
replies               int64
retweets              int64
text                 object
timestamp    datetime64[ns]
url                  object
img_url              object
dtype: object
Utility Function to get image name
This is an utility method to construct a meaningful filename.
It tries to use the text and the id column for name and picks up the extension (png/jpg) from the img_url
def get_image_name(id, text, img_url):
    res = str(id)
    if text:
        res = res + "_" + text.replace(" ", "_")
    try:
        extn = Path(img_url).suffix
    except:
        print(id, text, img_url)
    res = res + extn
    return res

# test
index = 232
img_url = df.iloc[index].img_url
id = df.iloc[index].id
text = df.iloc[index].text
img_name = get_image_name(id, text, img_url)
print(img_name)

#  946078250698018816_Bayes_Error.png
Get the image names and add it as a new column
img_names = []
for index, row in df.iterrows():
    img_name = get_image_name(row.id, row.text, row.img_url)
    img_names.append(img_name)
df['img_name'] = img_names
df.tail()
id text img_name
236 946078250698018816 Bayes Error 946078250698018816_Bayes_Error.png
237 945751084974333952 Occams Razor 945751084974333952_Occams_Razor.png
238 945717937234591744 K-Fold Cross-Validation 945717937234591744_K-Fold_Cross-Validatio...
239 945383421299191808 Extrema 945383421299191808_Extrema.png
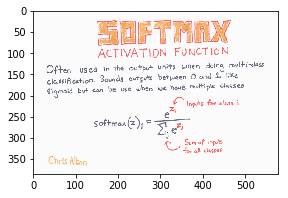
240 945363817839566849 Softmax Activation Function 945363817839566849_Softmax_Activation_Fun...
Utility function to download an image
def download_image(img_url, img_name):
    img_data = requests.get(img_url).content
    with open(img_name, 'wb') as handler:
        handler.write(img_data)
    return img_name

# test
downloaded_img = download_image(img_url, img_name)
print(downloaded_img)

#  945363817839566849_Softmax_Activation_Function.png
Download all images
Here is the main part of code which downloads all the image from the urls in the dataframe.
It is saved in the current working directory with name from img_name col
If we want to change the place where it is saved use %cd <targer_dir> to change the file location
n = len(df)
for index, row in df.iterrows():
    try:
        img_name = row.img_name
        img_url = row.img_url
        print(f"processing img {index + 1}/{n}", img_name, img_url)
        download_image(img_url, img_name)
    except Exception as inst:
        print("Error", index, inst, img_name, img_url)
Check date range of tweets
Lets check from what time to what time Chris had created them
min_date = df.timestamp.min()
max_date = df.timestamp.max()
print(min_date, max_date)
# 2017-08-02 17:39:43 2018-02-08 20:31:11
Not a huge range in time, we may not have much effect of time with the content of the material
Find top 5 liked and retweeted tweets
# top 5 liked and retweeted tweets
df_top5 = df.sort_values(by=['likes', 'retweets'], ascending=[False, False])[:5]
df_top5
likes  replies  retweets           timestamp                                          text
207   1815       74       700 2017-08-22 13:06:13
21      99        4        43 2017-10-26 19:25:53                              Simpsons Paradox
148     73        8        13 2017-12-22 18:21:54                                       Tensors
67      65        4        18 2017-11-23 20:51:11                                         Big O
217     65        2         6 2018-01-09 18:32:45  Normalized Initialization Of Neural Netwo...
Utility function to plot an image and images
def plot_img(img_name, size=(5, 3)):
    plt.figure(figsize=size)
    img = mpimg.imread(img_name)
    plt.imshow(img)

# test
plot_img(img_name)
def plot_images(img_names, titles, size=(20, 10), columns=5):
    plt.figure(figsize=size)
    #print(img_names)
    for i, img_name in enumerate(img_names):
        image = mpimg.imread(img_name)
        plt.subplot(len(img_names) / columns + 1, columns, i + 1)
        plt.title(titles[i][:25])
        plt.xticks([])
        plt.yticks([])
        plt.imshow(image)
cols = ['likes', 'replies', 'retweets', 'timestamp', 'text']
print(df_top5[cols])
plot_images(df_top5.img_name.values, df_top5.text.values)
likes  replies  retweets           timestamp                                          text
207   1815       74       700 2017-08-22 13:06:13
21      99        4        43 2017-10-26 19:25:53                              Simpsons Paradox
148     73        8        13 2017-12-22 18:21:54                                       Tensors
67      65        4        18 2017-11-23 20:51:11                                         Big O
217     65        2         6 2018-01-09 18:32:45  Normalized Initialization Of Neural Netwo...

Find top 5 oldest tweets
# top 5 oldest tweets
# wanted to check if more interesting topics are covering in the begining to start with
df_top5 = df.sort_values(by=['timestamp'], ascending=[True])[:5]
print(df_top5[cols])
plot_images(df_top5.img_name.values, df_top5.text.values)
        likes  replies  retweets           timestamp text
0        1        0         1 2017-08-02 17:39:43
208     17        0         2 2017-08-21 20:13:16
206     19        0         7 2017-08-22 17:33:19
205     18        0         7 2017-08-22 19:34:29
204     24        1         9 2017-08-23 17:41:59

Find most important tweets
Here the idea is that the tweets that are most liked, retweeted are considered more important. Before that we have to find if there is a difference between liked and retweeted tweets. Even before doing that analysis lets remove the super outlier.
# drop outlier
df.drop(207, inplace=True)
# check if oldest tweets are best
title = "Likes/Retweets vs Time"
df.plot(x='timestamp', y=['likes', 'retweets'],  kind='line', ylim=(0,120), figsize=(10,10), title=title, subplots=False)
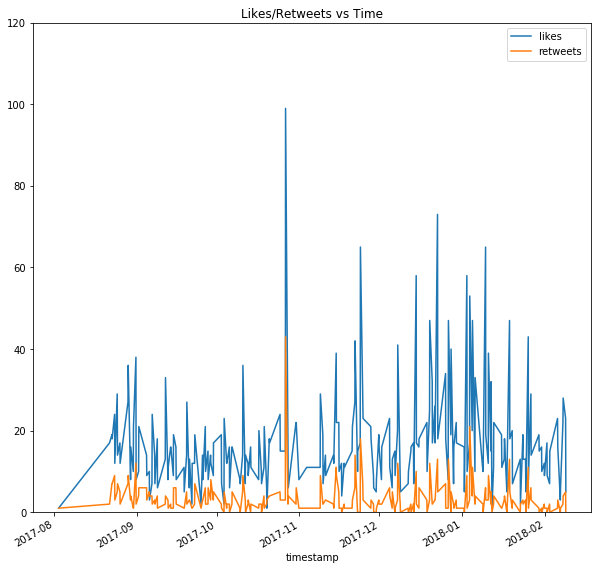
We can see recent tweets are gaining more attetion and being liked and shared more
# find above average tweets
likes_avg = df.likes.mean()
print(likes_avg)
df_above_average_liked = df[df.likes > likes_avg]

#17.199152542372882
df_above_average_liked.shape[0]
# 81
this is a big number, we have many above average tweets, lets find something managable (< 50)
Plot how the tweets are distributed
df.boxplot(column="likes", figsize=(10,10))
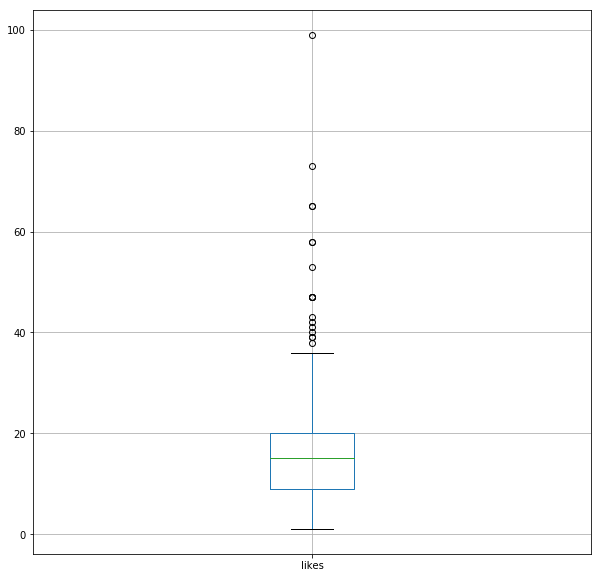
We see there are many outliers Lets pick the top 20% of tweet and check them
likes_80 = df.likes.quantile(0.80)
df_likes_80 = df[df.likes > likes_80]
print(df_likes_80.shape[0])
df_likes_80 = df_likes_80.sort_values(by=['likes'], ascending=[False])
df_likes_80
# 43
Ok, this looks like a manageble number for most important tweets to start looking from
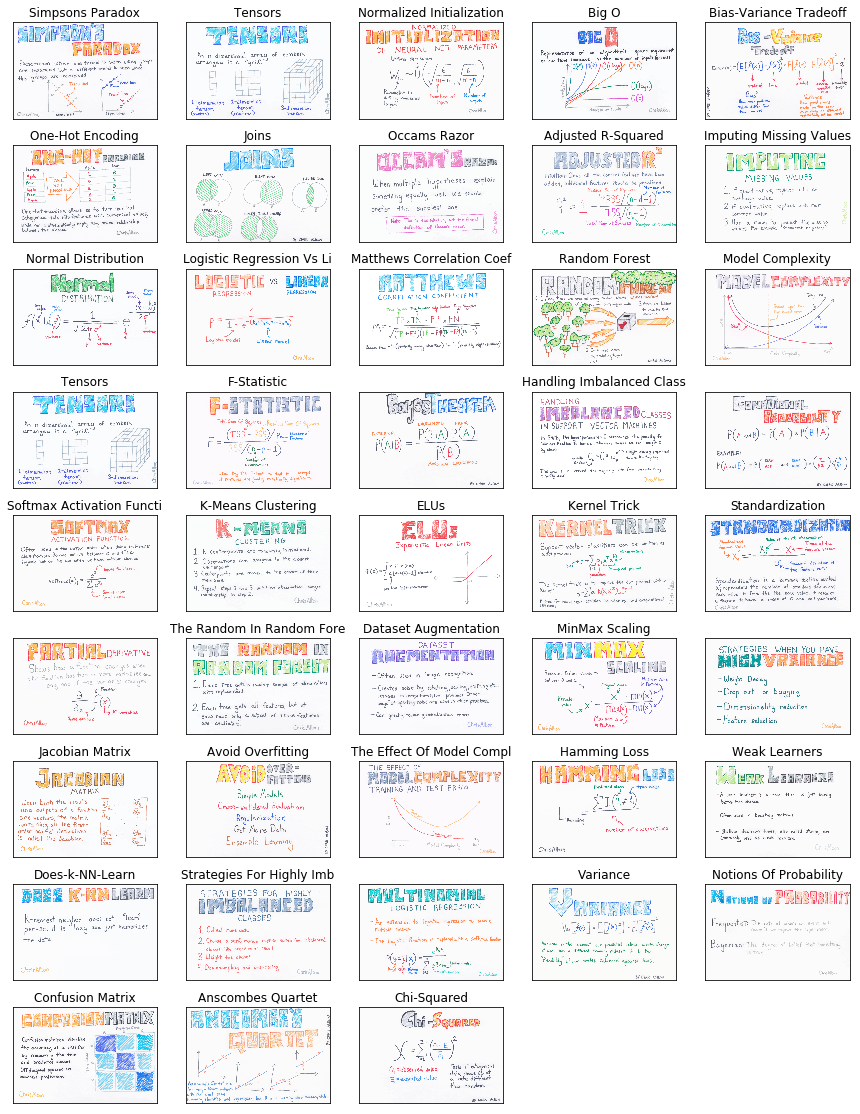
# most important (liked) tweet
plot_images(df_likes_80.img_name.values, df_likes_80.text.values,  size=(15, 20))
These are the most liked/retweeted tweets, these are either well done and something which people liked or it covers important material
This is a fun activity and we learned a few thing along the way. We also got a low res version of flashcards which are shared publicly on twitter.
If you are looking for flashcards in many formats (web-quality png, PDF, Anki, and SVG) with a better resolution, they are availabele from Chris’s site https://machinelearningflashcards.com/ for purchase.
If you cannot afford to it, request him on twitter @chrisalbon. Chirs seems like a generous guy, he may send one for free. Have fun, thanks for reading.
Will be back with another topic that interets us, till then, see you guys. If you have any comments, suggestions or ideas please feel free to share.